Energy + AI compute stress test (2030–2045): how big could the electricity bite get?
This is a first-pass Monte Carlo stress test for global electricity demand vs. AI compute growth (2030–2045). It is not a prediction; it’s a way to ask: what combinations of plausible(ish) assumptions blow up the grid?
TL;DR (numbers are from 50k draws)
Under the assumptions below, by 2045:
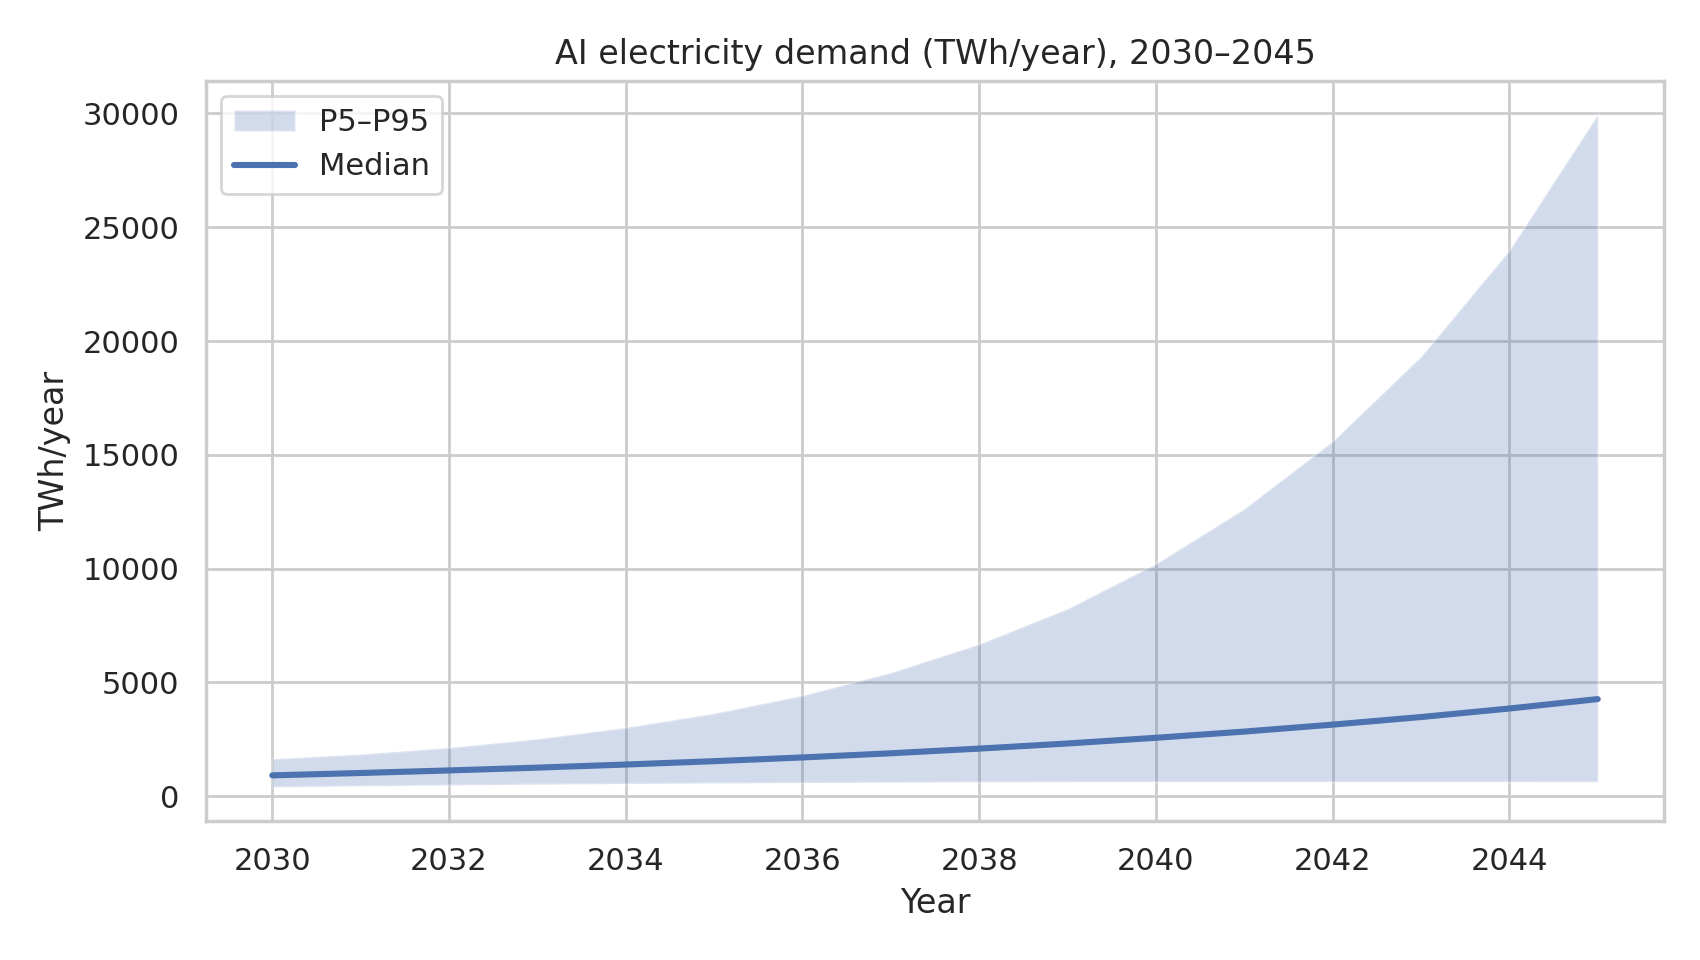
- AI electricity demand (median): ~4,300 TWh/yr (~490 GW average)
- AI electricity demand (P90): ~19,800 TWh/yr (~2,260 GW average)
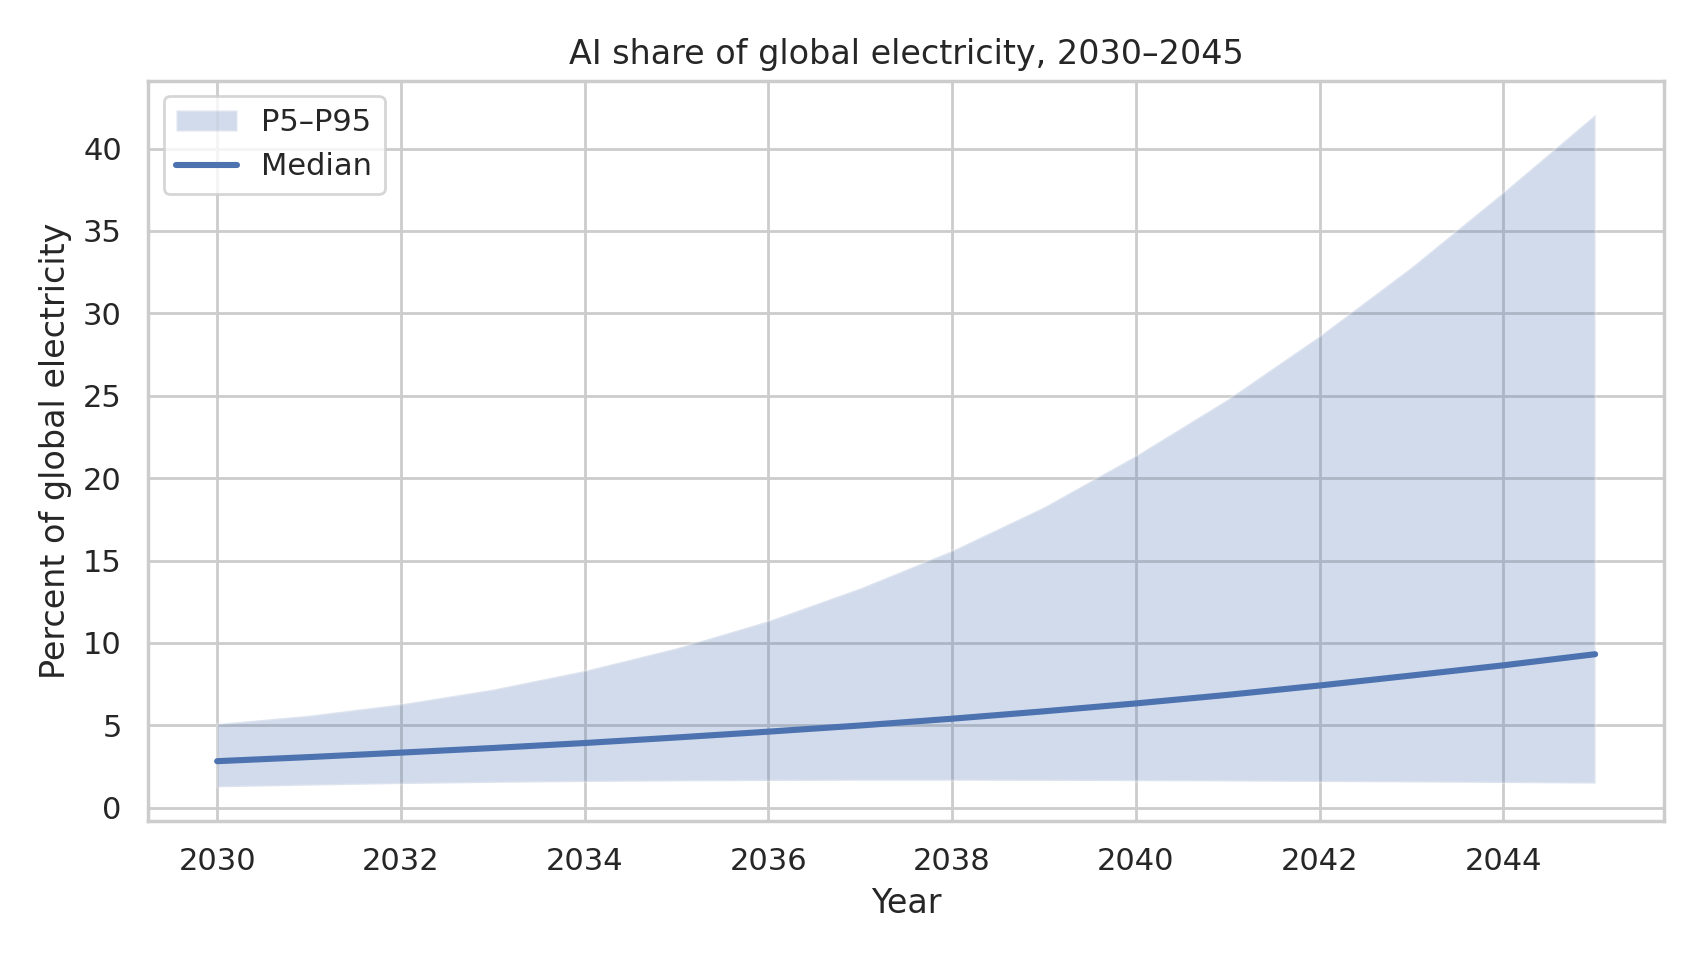
- AI share of global electricity (median): ~9.3%
- AI share of global electricity (P90): ~32%
Tail risk flags:
- P(AI share > 10%) ≈ 47%
- P(AI share > 20%) ≈ 23%
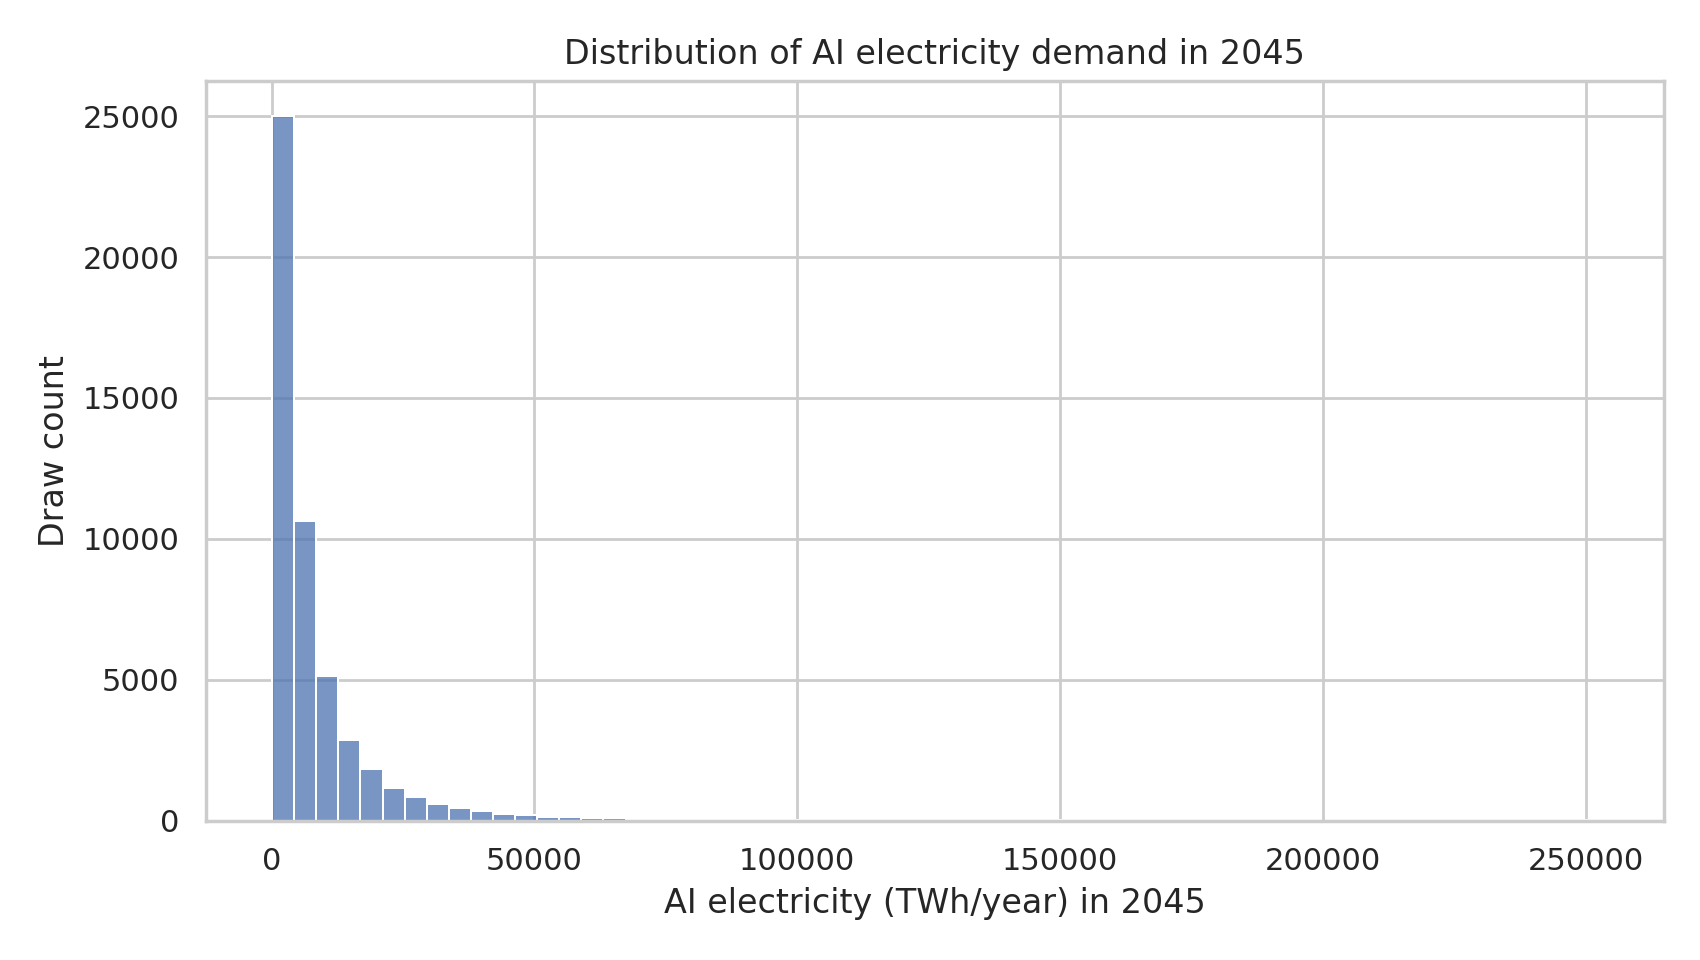
- P(AI electricity > 5,000 TWh/yr) ≈ 45%
Supply-side sanity check (very coarse):
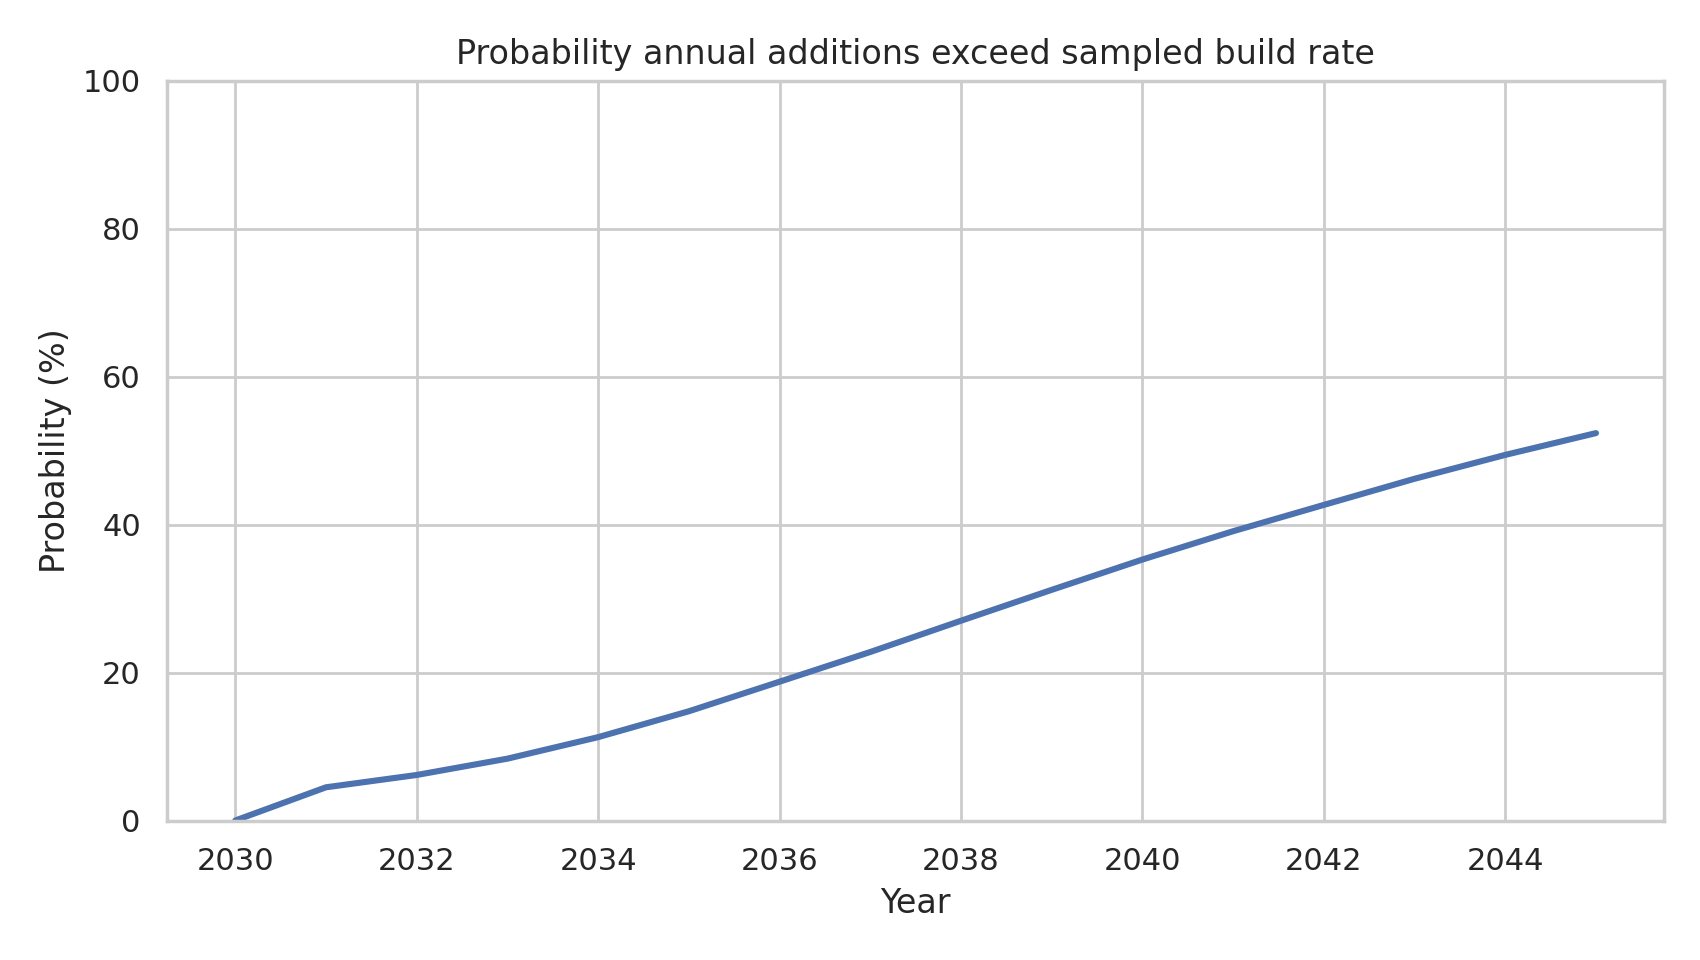
- P(any year 2031–2045 requires additions larger than a sampled “max build rate”) ≈ 52%
The point isn’t that 32% is “likely.” The point is: if compute growth outruns efficiency + PUE improvements, you quickly end up in regimes that require wartime-scale generation buildouts.
Model (minimal, explicit)
We split global electricity into non-AI and AI parts:
- Non-AI: grows with a sampled CAGR.
- AI: grows with sampled compute CAGR, shrinks with sampled efficiency improvement (J/compute), is scaled by a PUE trajectory, plus a “rebound” multiplier to represent new applications / higher QoS.
Formally, for each Monte Carlo draw:
- (E_{\text{nonAI}}(t) = E_{\text{nonAI},2030} (1+g_{\text{nonAI}})^{\Delta t})
- (E_{\text{AI}}(t) = E_{\text{AI},2030} \left(\frac{1+g_{\text{compute}}}{1+g_{\text{eff}}}\right)^{\Delta t} \cdot \frac{\text{PUE}(t)}{\text{PUE}_{2030}} \cdot \text{rebound}(t))
- (E_{\text{total}}(t) = E_{\text{nonAI}}(t) + E_{\text{AI}}(t))
Units are TWh/year. Average power conversion: GW ≈ (TWh/year) / 8.76.
GPU acceleration: if CuPy + CUDA are available, the simulation runs on GPU; otherwise NumPy.
Assumptions (triangular priors)
These are intentionally “fat” because this is a stress test.
2030 baselines
- Global electricity in 2030 (TWh/yr): [28k, 32k, 38k]
- AI electricity in 2030 (TWh/yr): [200, 700, 2000] (capped at 20% of global in 2030)
Growth and efficiency (CAGR)
- Non-AI electricity CAGR: [0.8%, 1.8%, 3.0%]
- AI compute usage CAGR: [15%, 30%, 55%]
- AI efficiency improvement CAGR (J/compute decline): [10%, 20%, 32%]
Datacenter overhead (PUE)
- PUE 2030: [1.15, 1.25, 1.40]
- PUE 2045: [1.08, 1.15, 1.30] (linear path)
Rebound (2045 multiplier)
- Rebound multiplier by 2045: [0.9, 1.1, 1.6] (linear path)
Supply-side “max build rate” (TWh/year)
- Max annual additions: [600, 1200, 2000]
That last parameter is a deliberately crude proxy for buildout limits; it’s there to catch scenarios where demand growth implies implausibly large annual additions.
Results (plots)
AI electricity demand: 2030–2045
AI share of global electricity
2045 distribution (heavy tail)
Supply stress probability (coarse check)
What actually drives the tail?
The dominant variable is the gap between:
- compute growth (how much more AI we do), and
- efficiency + PUE improvement (how cheaply we do it).
If (g_{\text{compute}}) is persistently high and (g_{\text{eff}}) disappoints (or rebound is strong), the model quickly produces multi-thousand-TWh AI demand.
In other words: the regime change happens when “efficiency progress” becomes insufficient to offset the scale of deployment.
Falsifiers (what would make this model wrong in useful ways)
If any of these happen, the distribution should shift materially:
- Measured global AI electricity in ~2030 lands far outside 200–2000 TWh/yr (baseline prior is wrong).
- Compute growth saturates (e.g., enterprise/consumer demand plateaus or regulatory caps bite), moving long-run CAGR below ~15%.
- Efficiency improvements accelerate beyond ~30%/yr sustained (hardware + algorithmic efficiency + utilization), collapsing energy intensity faster than assumed.
- PUE improvement stalls (constraints on cooling/water/ambient heat), increasing overhead and worsening tails.
- Workload mix shifts (inference dominates with very different utilization + latency constraints), breaking the single “compute CAGR” proxy.
- Energy system response is faster than expected (massive nuclear/renewables/storage buildout), making the supply-stress proxy too pessimistic.
Reproduce
From the repo root:
python3 -m venv .sim-venv
source .sim-venv/bin/activate
pip install -U pip
pip install numpy pandas matplotlib seaborn tqdm
python scripts/run_energy_ai_stress.py --out docs/analysis/energy-ai-stress --n 50000 --seed 7
Artifacts:
docs/analysis/energy-ai-stress/summary_by_year.csvdocs/analysis/energy-ai-stress/draws_wide.csvdocs/img/energy-ai-stress/*.png
Next iterations
This is intentionally simple. Obvious upgrades:
- Calibrate priors to published datasets (IEA/Ember, hyperscaler disclosures).
- Separate training vs inference, and add utilization constraints.
- Model geographic grid constraints (not just global energy).
- Add explicit capex/lead-time dynamics for generation + transmission.
Code: scripts/energy_ai_stress.py.